


Salt Lake City
MULTIFAMILY
REPORT
DOWNLOAD FULL REPORT
2024 | MID-YEAR
Annual Rent Change
Annual Inventory CHANGE
Deliveries & Absorption
Employment
Rent & Occupancy
Sales
Jobs Added / Lost*
LAST 12 MONTHS
13,900

1.7% YOY
Unemployment*
June 2024
3.0%
30 BPS YOY

Salt Lake City has one of the nation’s hottest job market, creating housing demand and supporting apartment fundamentals. Over the past year, 13,900 net jobs have been added to local payrolls, increasing employment across the metro 1.7%. Meanwhile, unemployment was at 3.0% during June 2024, 110 basis points below the national average. The metro’s economy is driven by white-collar industries such as tech and finance, giving Salt Lake City the nickname “Silicon Slopes.” These industries are supported by the highly educated workforce in the area. Roughly 67% of the market’s population are white-collar workers, compared to 64% nationally. Salt Lake City also boasts a diverse economy with industries such as private education and healthcare and trade, transportation, and utilities having large market shares of employment. The private education and healthcare sector added the most net jobs compared to other sectors, expanding by 5,200 net employees in the last year. The University of Utah Hospital, a major area employer, has ranked top 10 in the country for quality for the past 14 years. Reported in the Salt Lake Tribune, their hospital and clinic workers have felt the effects of Salt Lake City’s growing population and nurse to patient ratios have reached 1:10, creating a demand for more healthcare professionals. Congruently, Intermountain Healthcare unveiled plans for a new urban hospital at Sears block in June. Renderings show that the new hospital will be 12 stories and include a 10-story parking structure.
EMPLOYMENT

Mars to buld $237M Natures Bakery facility, add 190 jobs
READ MORE
DataBanl to expand SLC6 data center in Salt Lake City
READ MORE
Salt Lake City #1 job market in the country
READ MORE
EMPLOYMENT TRENDS
IN THE NEWS
Salt Lake City is on pace to have a record-breaking year in multifamily housing demand. In the first two quarters of 2024 demand has outpaced incoming supply metrowide, with 3,584 net move-ins while 3,293 units were delivered. By the end of 2024, 7,885 net units are projected to be absorbed, eclipsing the previous record from 2021 by over 1,200 units. Meanwhile, an estimated 7,991 units will come online by the end of 2024, just shy of the number of units delivered in 2023. With 20,498 units either under construction or lease up in the market pipeline, incoming inventory will maintain its recent pace of roughly 8,000 to 8,300 units coming online each year, looking ahead at 2025. The sustained multifamily growth in the Greater Salt Lake City area is underpinned by its growing economy and quality of life that attracts more people to the area. Living in the Salt Lake City metro, residents have access to major tech and finance employers such as Goldman Sachs and SoFi, world-class outdoor activities, and a growing entertainment scene downtown. In April, the former Arizona Coyotes made Salt Lake City their new home, becoming the first NHL team to be based in Utah. Additionally, the metro is surrounded by the Wasatch Mountain Range, home to 10 world-class ski resorts and countless hiking and biking trails. For these reasons, more people have been relocating to Utah, which accounted for 56% of the state’s population increase.
Deliveries & Absorption
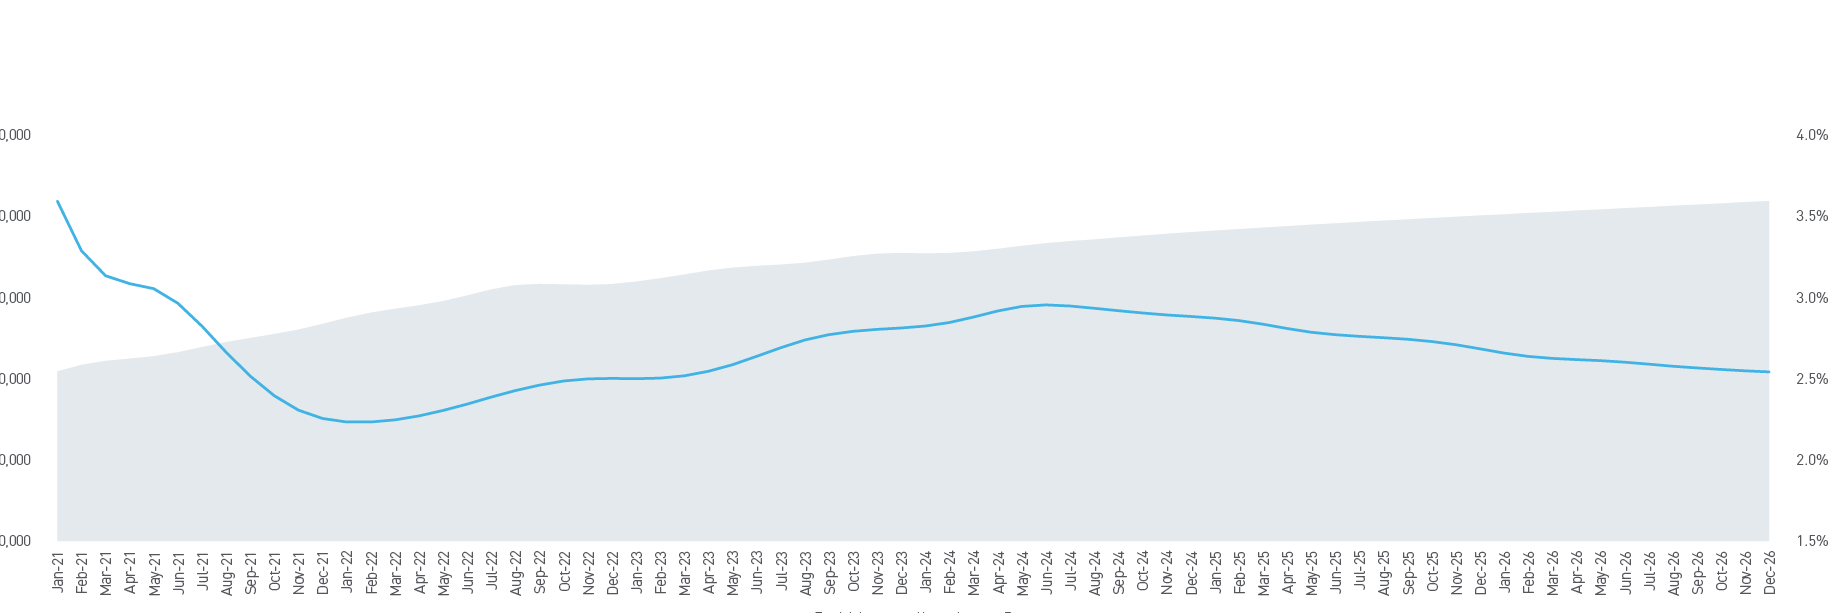
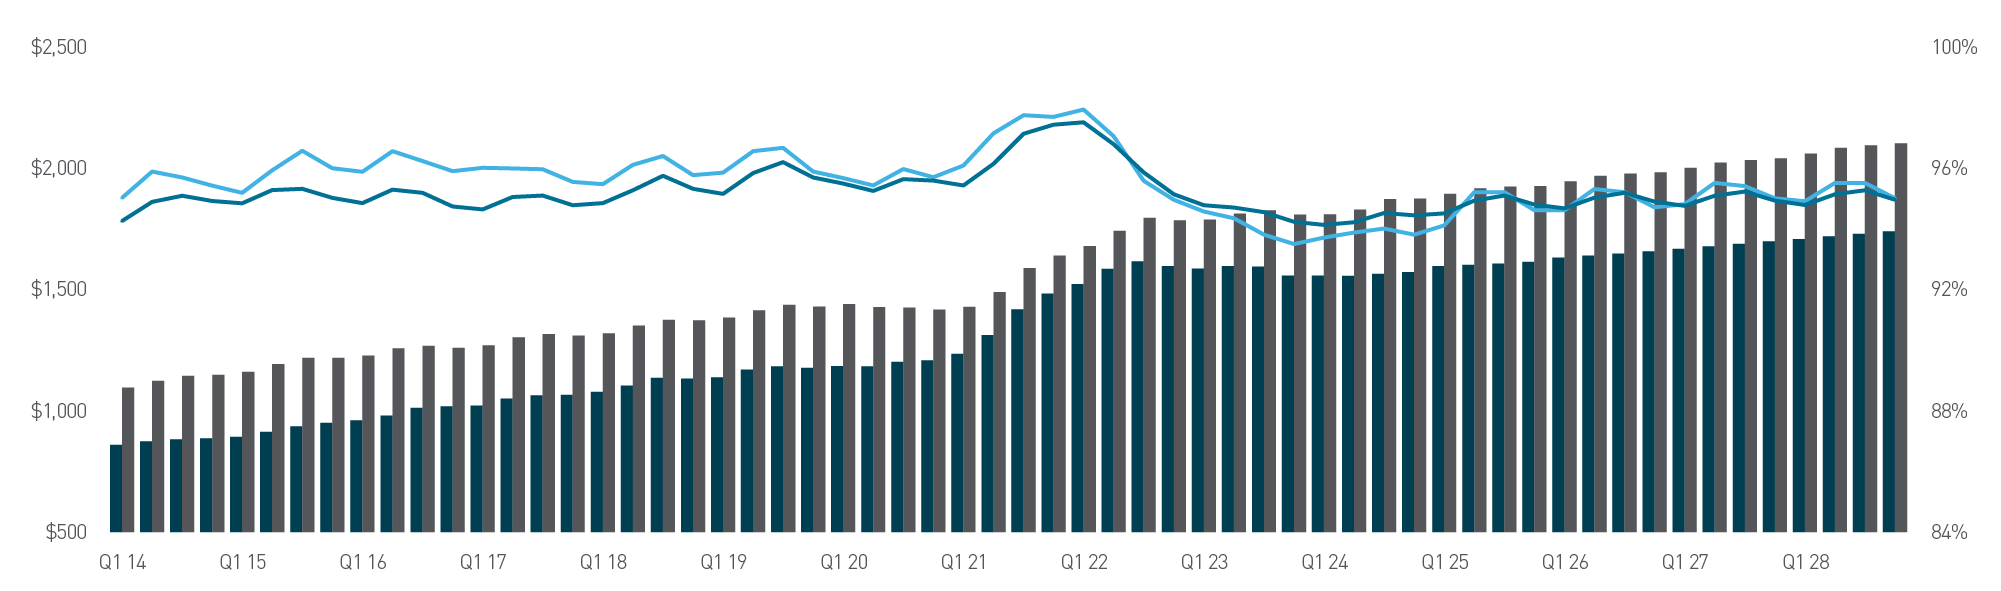
As of midyear 2024, the average effective rent was $1,555 per month across the metro, down 2.5% annually. Meanwhile, occupancy was also down 40 basis points year over year, resting at 93.9% during the second quarter of 2024. The dip in effective rent and occupancy can be explained by the imbalance between inventory and net absorption during 2023. With over 8,000 units coming online and only 5,992 units being absorbed, the lack of demand drove effective rent prices down and the abundance of units lowered occupancy. Despite occupancy dropping at the metro level, the Downtown Salt Lake/University and South Salt Lake/Murray submarkets saw positive occupancy change annually. Downtown Salt Lake/University occupancy rose 20 basis points year over year reaching 93.5%. Meanwhile, occupancy rose 30 basis points annually in South Salt Lake/Murray. With the median age of metro residents being 33.0, the Salt Lake City boasts a strong renter pool, which will underpin the forecasted increases in effective rent and occupancy. Looking forward, the uptick in demand during 2024 and continuing into 2025 will positively impact effective rent and occupancy rates. By the same time next year, occupancy is projected to jump to 95.2%, an increase of 130 basis points annually, and effective rent is predicted to rise 3.0%, reaching $1,601 per month.
RENT & OCCUPANCY
2024 Year to Date*
VOLUME
Nondisclosure

CAP RATE (AVG)
Nondisclosure

Price Per Unit (AVG)
Nondisclosure
TRANSACTIONS
5

WHAT’S TRADING?*

BUILDINGS (AVG)
8

ACRES (AVG)
12.71
YEAR BUILT (AVG)
2000s

UNITS (AVG)
273

Sources: MSCI Real Capital Analytics; CoStar Group; Berkadia Research
SALES


2024 YEAR TO DATE
DELIVERIES
3,293 UNITS

2024 TOTAL*

ABSORPTION
3,584 UNITS
DELIVERIES
7,991 UNITS
ABSORPTION
7,885 UNITS
Effective rent
Q2 2024
$1,555
2.5% YOY
OCCUPANCY
Q2 2024
93.9%
40 BPS YOY


*$50m+
SELLER
Wasatch Group �Investors Capital
Logan, UT�Seattle, WA
LOCATION


Buyer
DiNapoli Capital Partners �Millburn & Company �TruAmerica Multifamily �Guardian Life Insurance �Peak Capital Partners
Walnut Creek, CA�Salt Lake City, UT�Los Angeles, CA�New York, NY�Provo, UT
Location

Top Buyers*
Top Sellers*

BACK TO TOP


*Projected
Source: RealPage
Y-o-Y Effective Rent Change

( 1 . 9%) - ( 0 . 7%)
( 3. 7%) - ( 2 . 0 %)
( 5. 9%) - ( 3. 8%)
( 6. 0 %)
1. Downtown Salt Lake City / University 2. Layton / Davis County
3. Midvale / Sandy / Draper
4. Ogden / Weber County
5. South Salt Lake / Murray
6. Southwest Salt Lake City
7. West Valley City / Airport Area
SUBMARKET BOUNDARIES
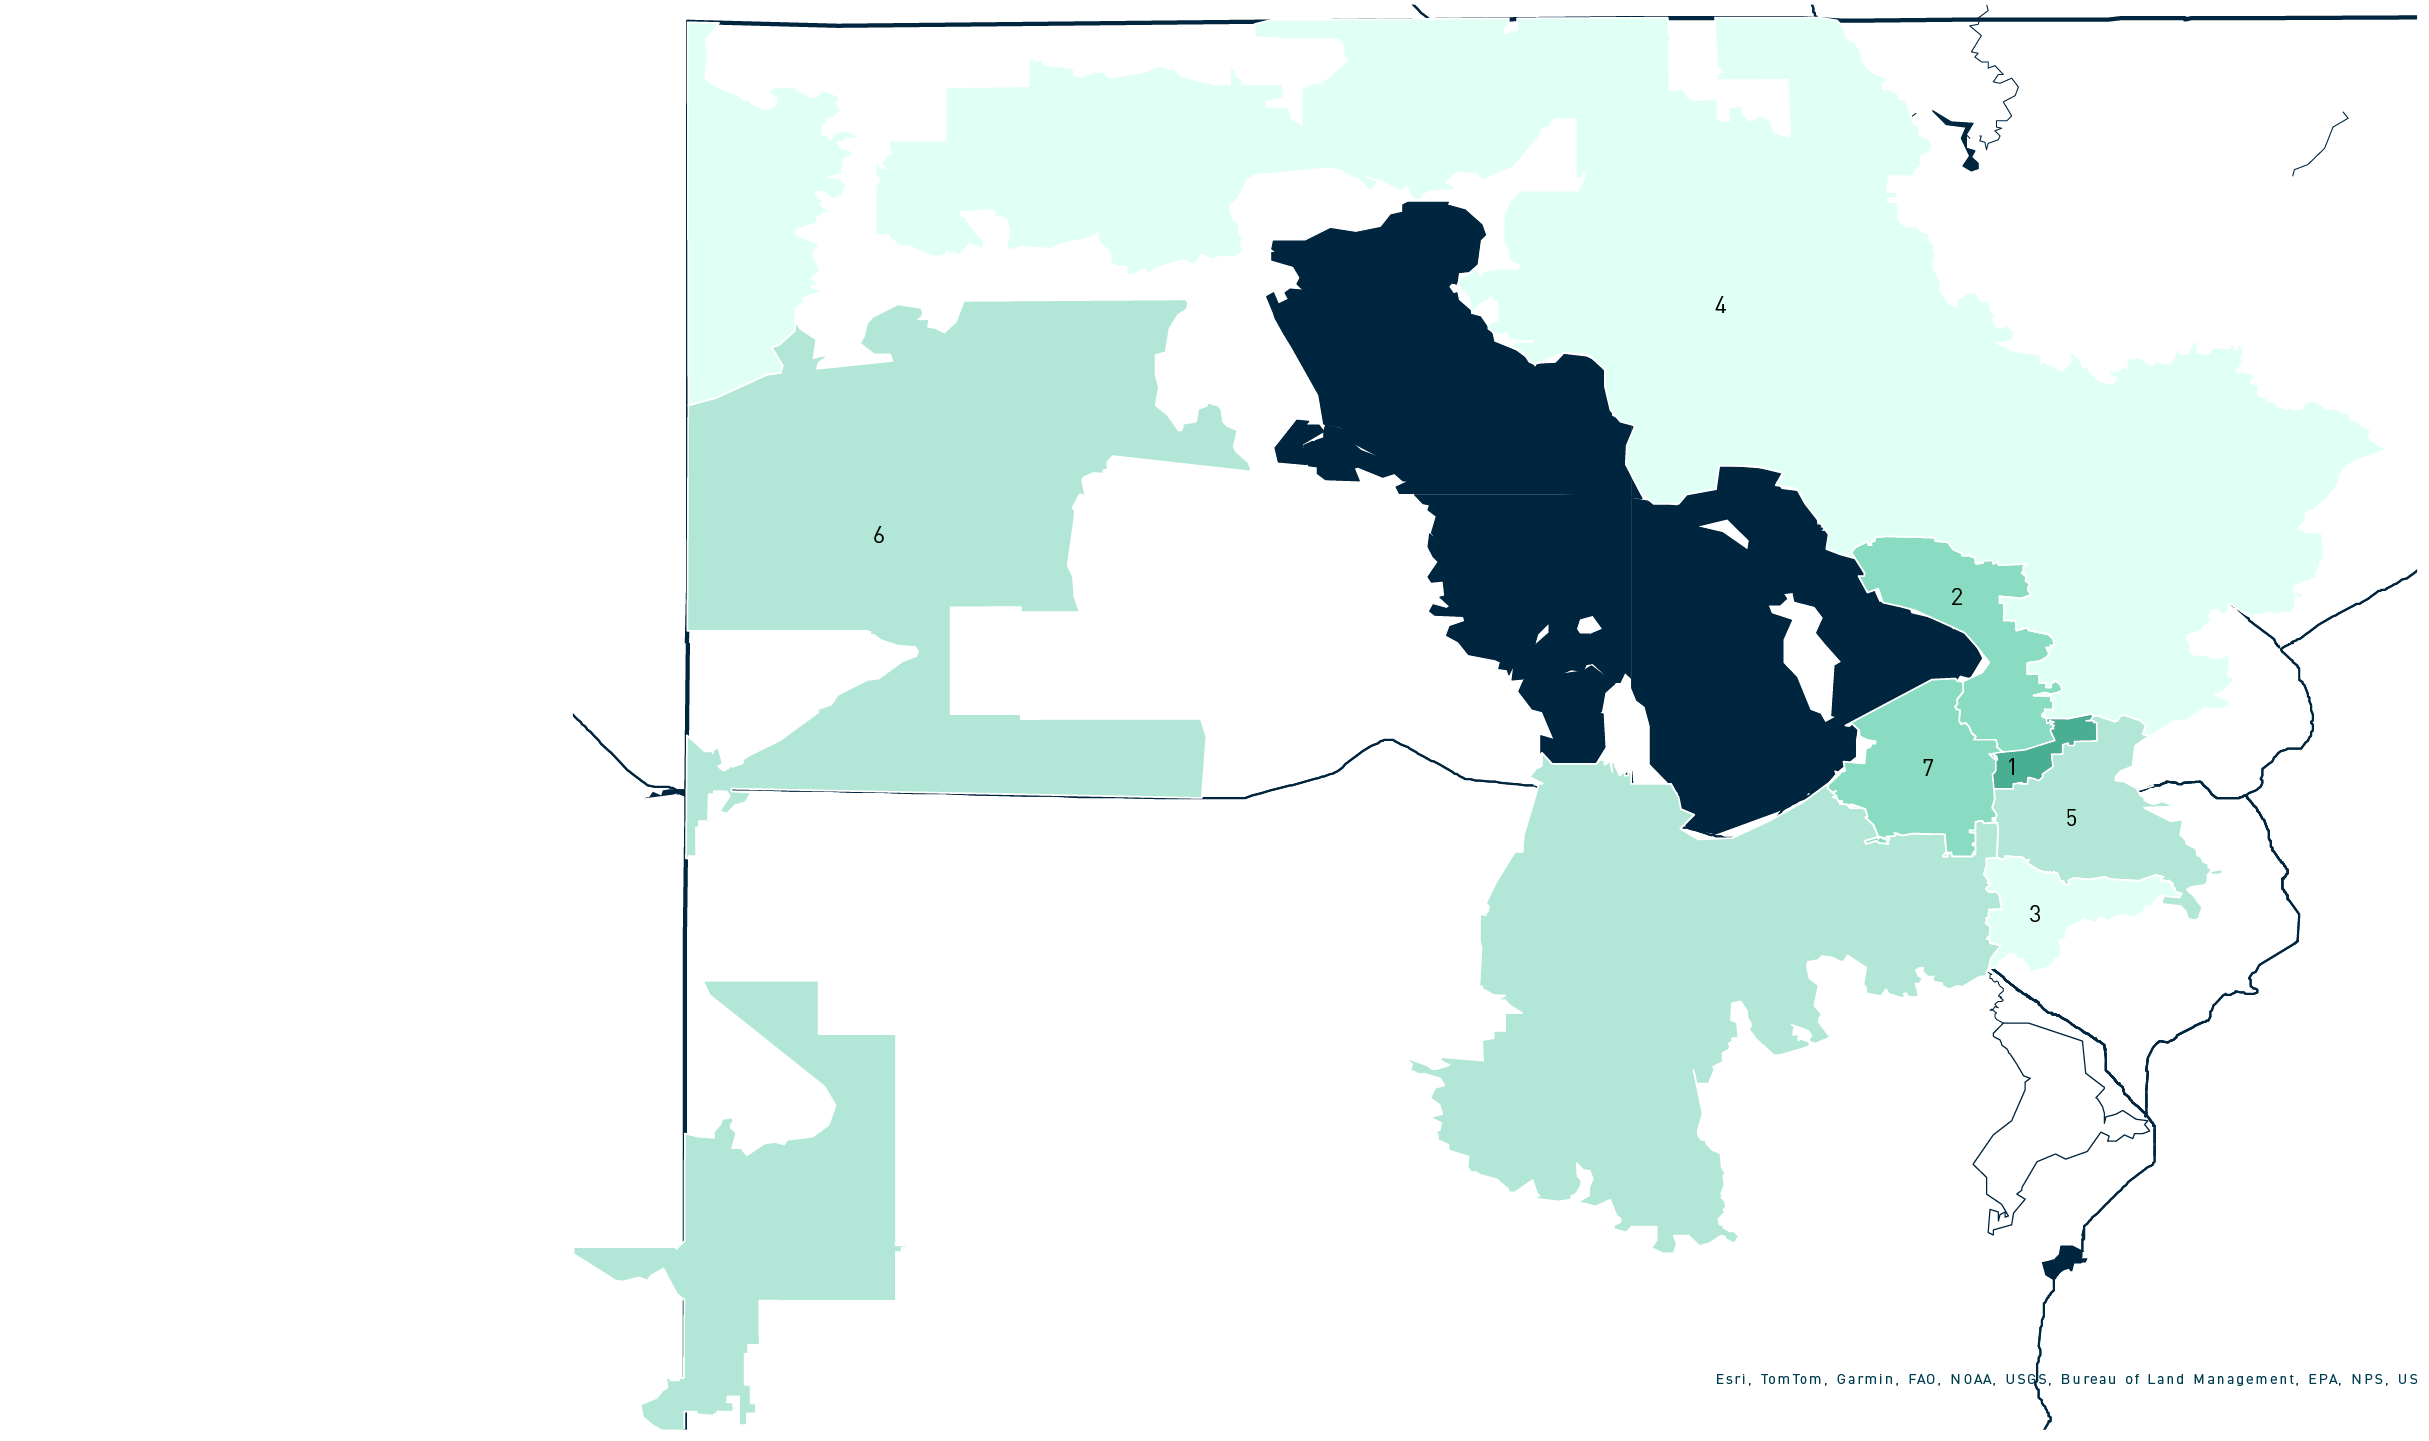
Each submarket saw a dip in effective rents over the past year. After a record amount of inventory hit the market in 2023, apartment operators across the metro were pressured to raise concessions. The Midvale/Sandy/Draper submarket was the least impacted and offered the lowest concessions, 4.3% of asking rent. With demand outpacing deliveries by nearly 50% during the past two quarters, the submarket was able to withstand major effective rent decreases unlike the Downtown Salt Lake City/ University submarket. Looking ahead at the next 12 months, each submarket will experience positive rent change. The Ogden/Weber County submarket is projected to see the biggest rise in effective rent and occupancy over the next year. By midyear 2025, effective rent is expected to increase 3.7%. The submarket boasts one of the lower effective rents per month, attracting new residents to the area.
SUBMARKET MID-YEAR 2024 ANNUAL RENT Change
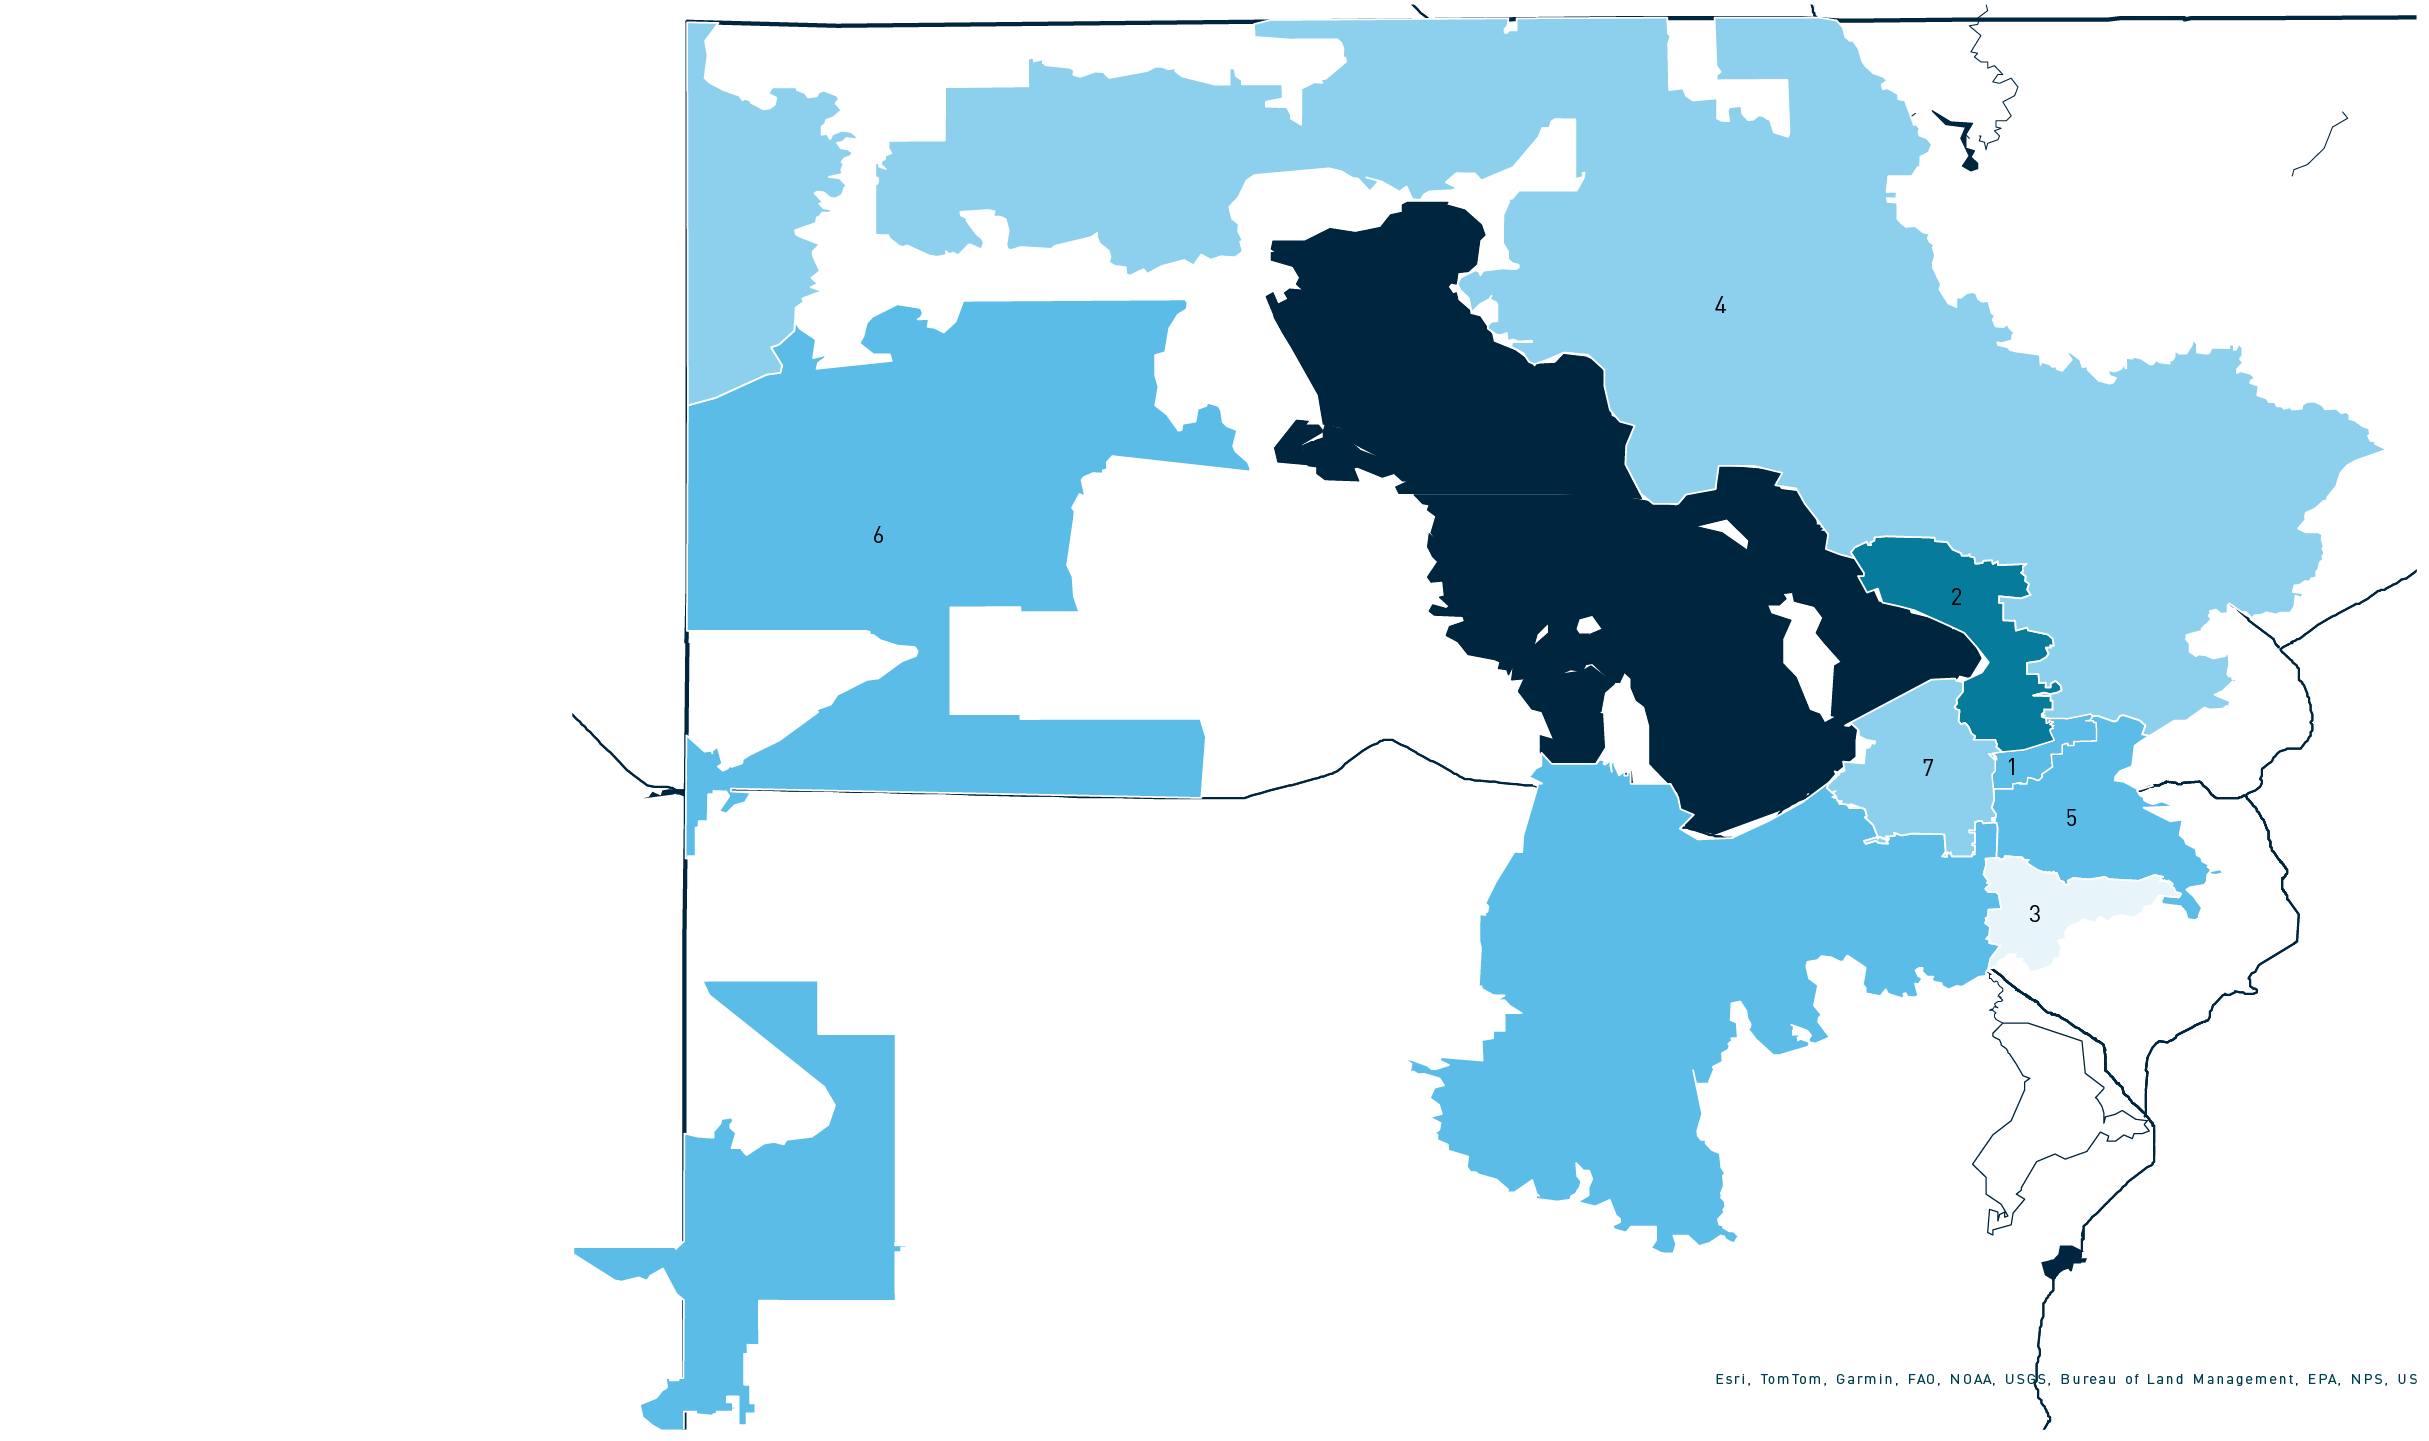
Annual Inventory Change
0 . 0 % - 1 . 6%
1 . 7% - 4. 7%
4. 8% - 8. 3%
8. 4% - 1 0 . 0 %
1. Downtown Salt Lake City / University �2. Layton / Davis County
3. Midvale / Sandy / Draper
4. Ogden / Weber County
5. South Salt Lake / Murray
6. Southwest Salt Lake City
7. West Valley City / Airport Area
SUBMARKET BOUNDARIES
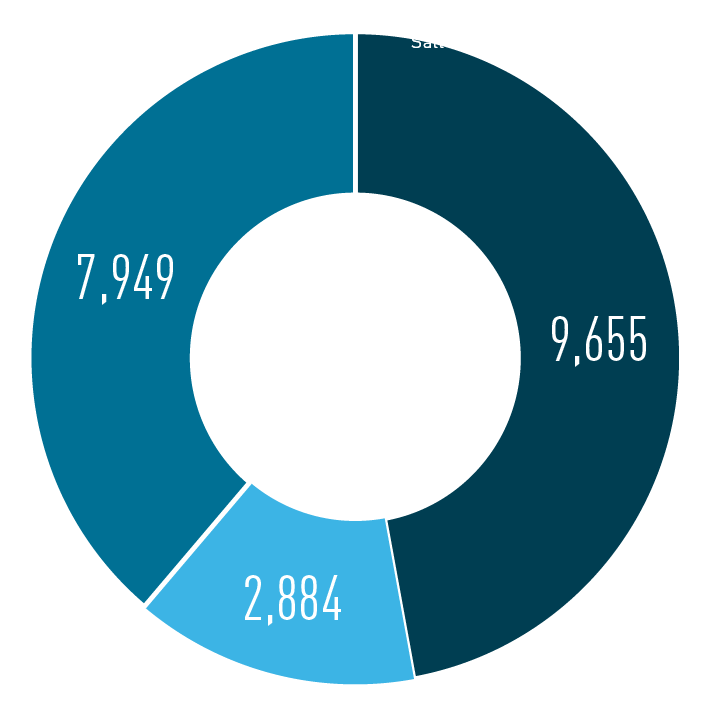
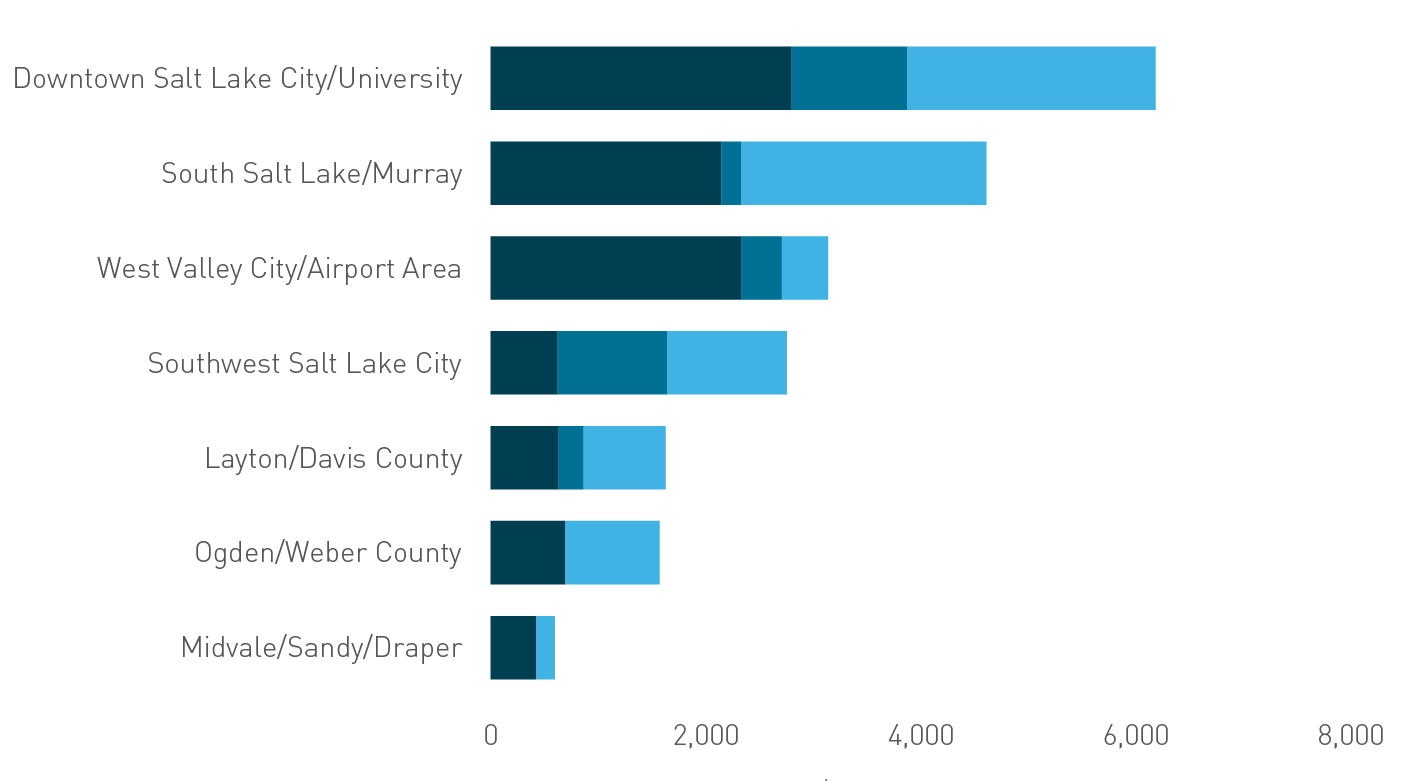
In the first half of 2024, each submarket had demand outpace deliveries. Compared to the other submarkets in the metro, the South Salt Lake/Murray submarket had the highest number of deliveries and net move-ins. During the first two quarters of 2024, 1,078 units came online while 1,260 units were absorbed within the submarket. South Salt Lake/Murray has a prime location that caught the attention of residents and multifamily developers alike. It neighbors Downtown Salt Lake and the University of Utah, allowing quick access to major employers while also being closer to the mountains for a more affordable price compared to the Downtown Salt Lake/University submarket. Looking ahead, it seems as if the focus will shift back to Downtown Salt Lake/University, since a majority of projects in the pipeline are based in that submarket. Currently, there are 2,800 units under construction, 2,313 units lease up, and 1,074 that are both.
SUBMARKET MID-YEAR 2024 ANNUAL Inventory Change
SUBMARKET MID-YEAR 2024 ANNUAL Inventory Change
SUBMARKET MID-YEAR 2024 ANNUAL RENT Change

QUICK ACCESS MENU
National & Institutional Markets


San Francisco-Oakland

San Jose
Atlanta
Orlando
Austin
Dallas-Fort Worth
Las Vegas
Phoenix
Salt Lake City
Washington, D.C.
Philadelphia
South Florida
Seattle-Tacoma
San Diego
Los Angeles
Orange County
Houston
Chicago
Boston
National Market Report
Atlanta
Austin
Boston
Chicago
Dallas-Fort Worth
Houston
Washington, D.C.
Phoenix
South Florida
Los Angeles
Orange County
Orlando
Philadelphia
San Diego
San Francisco-Oakland
San Jose
Seattle-Tacoma
Las Vegas
Salt Lake City

QUICK ACCESS MARKET MENU
© 2024 Berkadia Real Estate Advisors LLC
Berkadia® is a trademark of Berkadia Proprietary Holding LLC Commercial mortgage loan origination and servicing businesses are conducted exclusively by Berkadia Commercial Mortgage LLC and Berkadia Commercial Mortgage Inc. This website is not intended to solicit commercial mortgage loan brokerage business in Nevada. Investment sales and realestate brokerage businesses are conducted exclusively by Berkadia Real Estate Advisors LLC and Berkadia Real Estate Advisors Inc. For state licensing details for the above entities, visit: www.berkadia.com/legal/licensing.aspx
The information contained in this flyer has been obtained from sources we believe to be reliable; however, we have not conducted any investigation regarding these matters and make no warranty or representation whatsoever regarding the accuracy or completeness of the information provided. While we do not doubt its accuracy, we have not verified it and neither we, nor the Owner, make any guarantee, warranty or representation of any kind or nature about it. It is your responsibility to independently confirm its accuracy and completeness. Any projections, opinions, assumptions or estimates used are for example and do not necessarily represent past, current or future performance of the property. You and your advisors should conduct a careful and independent investigation of the property to determine to your satisfaction the suitability of the property and the quality of itstenancy for your records.

EMPLOYMENT
DELIVERIES & ABSORPTION
ANNUAL INVENTORY CHANGE
RENT & OCCUPANCY
ANNUAL RENT CHANGE
SALES
QUICK ACCESS MARKET MENU
QUICK ACCESS MENU
National & Institutional Markets
San Francisco-Oakland
San Jose
Austin
Dallas-Fort Worth
Las Vegas
Phoenix
Salt Lake City
Washington, D.C.
Philadelphia
Seattle-Tacoma
San Diego
Los Angeles
Orange County
Houston
Chicago
Boston
National Market Report
Atlanta

Austin

Boston

Chicago

Dallas-Fort Worth

Houston

Washington, D.C.

Phoenix

South Florida

Los Angeles

Orange County

Orlando

Philadelphia

San Diego

San Francisco-Oakland

San Jose

Seattle-Tacoma

Las Vegas

Salt Lake City

Atlanta
Orlando
South Florida

Under Construction/Lease-Up
Lease-Up
Under Construction / Lease-Up
Lease-Up
Deliveries
Absorption
Effective Rent Change
Source: RealPage
Source: RealPage
National Effective Rent
Salt Lake City vs. National Effective Rent & Occupancy
Salt Lake City Occupancy
SUBMARKET PERFORMANCE


Source: Moody’s Analytics
Source: RealPage
Downtown Salt Lake City/University�Layton/Davis County�Midvale/Sandy/Draper�Ogden/Weber County�South Salt Lake/Murray�Southwest Salt Lake City�West Valley City/Airport Area
93.5%�93.6%�94.4%�92.8%�94.9%�94.0%�92.8%
20�-100�-20�-180�30�-60�-80
$1,744�$1,428�$1,609�$1,468�$1,570�$1,588�$1,398
-6.0%�-3.8%�-0.7%�-1.4%�-2.1%�-2.0%�-4.8%
Q2 2024 Occupancy
YOY (BPS)
Q2 2024 Effective Rent
YOY


ANNUAL INVENTORY CHANGE
DELIVERIES & ABSORPTION
EMPLOYMENT
ANNUAL RENT CHANGE

SALES
RENT & OCCUPANCY
SUBMARKET MID-YEAR 2024 ANNUAL RENT Change
SUBMARKET MID-YEAR 2024 ANNUAL Inventory Change
Deliveries, Absorption, & effective rent change
Market Pipeline
Top submarket pipelines
Under Construction
Under Construction
DOWNLOAD FULL REPORT
DOWNLOAD FULL REPORT


Unemployment Rate
Total Jobs
Salt Lake City Effective Rent
National Occupancy
Effective rent and occupancy reflect stabilized properties and does not include preleased units or properties in lease-up. A newly constructed property is considered stabilized once it becomes 85% occupied.
*Seasonally Adjusted
