


Phoenix
MULTIFAMILY
REPORT
DOWNLOAD FULL REPORT
2024 | MID-YEAR
Annual Rent Change
Annual Inventory CHANGE
Deliveries & Absorption
Employment
Rent & Occupancy
Sales
Jobs Added / Lost*
LAST 12 MONTHS
58,800

2.4% YOY
Unemployment*
June 2024
3.5%
10 BPS YOY

The Phoenix metro is one of the nation's fastest-growing and most dynamic economies. Companies are targeting the metro to either relocate their headquarters or expand their facilities due to the business-friendly environment, affordability, availability of land, and depth of skilled talent. The Valley's overall employment has become exponentially more diversified over the past 15 years with key industries that include high-tech manufacturing, professional and business services, private education and healthcare, advanced technology, tourism, and trade and logistics. During the 12-month period ending in June 2024, Phoenix metro area employers added a net 58,800 jobs. The presence of manufacturing companies has rapidly grown over the past decade. Phoenix has quickly become a hub for semiconductor production, with prominent corporations like TSMC, Intel, and NXP building new state-of-the-art facilities as the country tries to domesticate the production of semiconductors on the mainland. This trend has created a ripple effect for companies that support semiconductor facilities in the Phoenix area. The private education and healthcare sector led all job sectors in job growth during the 12-month period ending in June 2024, expanding 6.7% and adding 26,300 new jobs. As the Valley experiences significant population growth, there is a need to expand to better serve suburban communities’ healthcare needs. The recently opened brand new Valleywise Health Medical Center in Downtown Phoenix brings a modern 10-story, 425 bed hospital to the region.
EMPLOYMENT

XNRGY breaks ground on manufacturing facility and U.S. headquarters in Mesa
READ MORE
Discount Tire keeps growing with acquisition of New York firm
READ MORE
Kohler unveils facility in Casa Grande, creating 400 full-time jobs
READ MORE
EMPLOYMENT TRENDS
IN THE NEWS
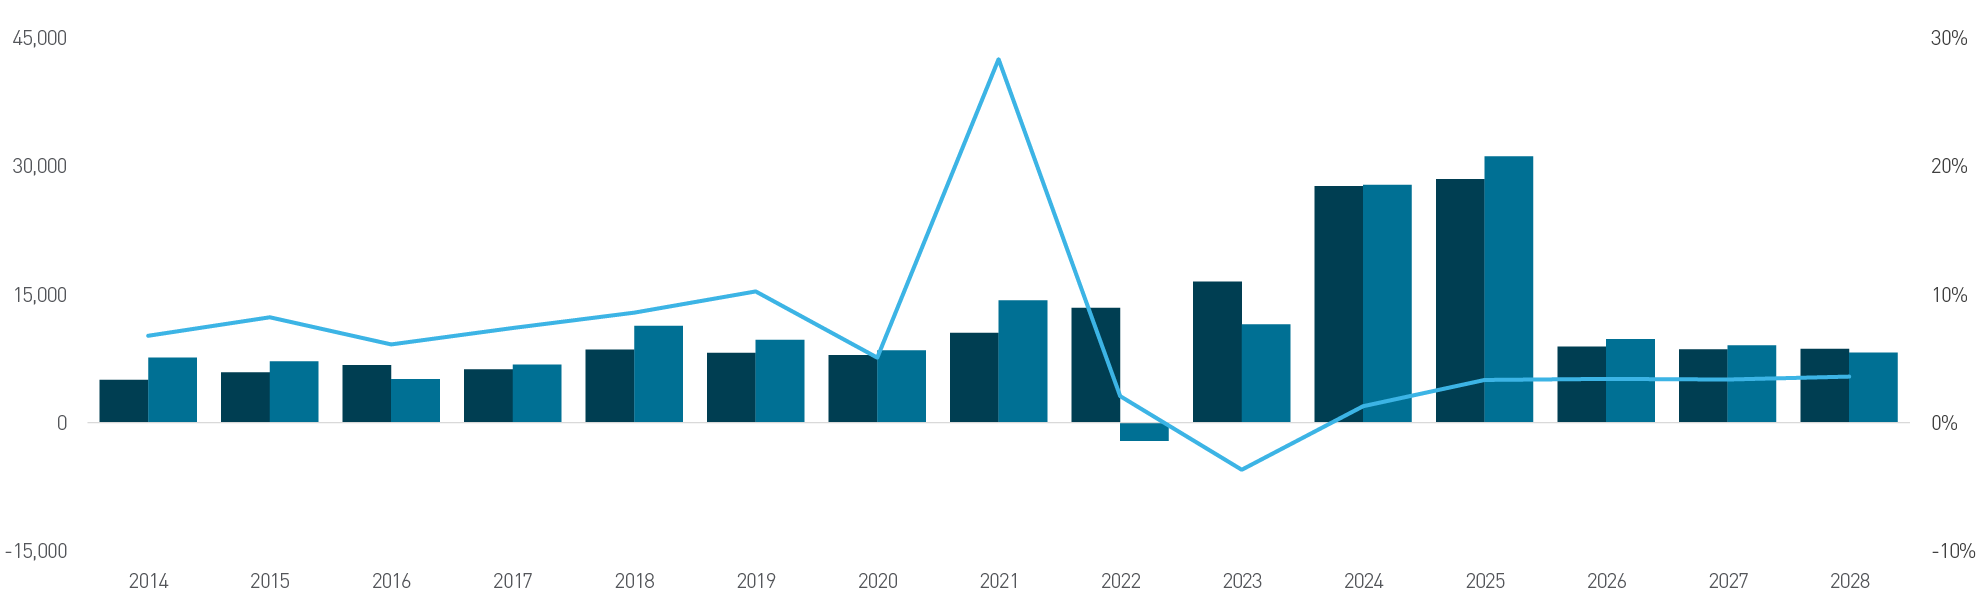
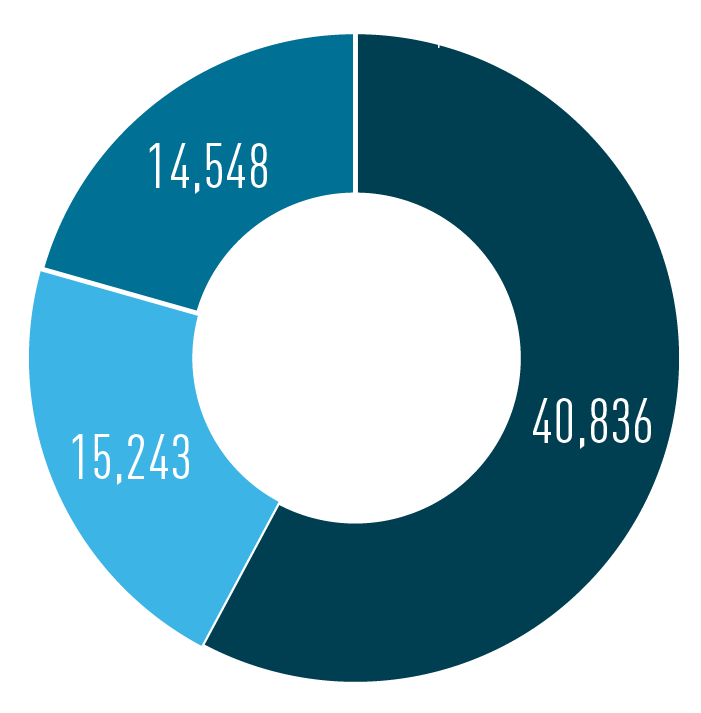
The Phoenix Metro has experienced tremendous population growth, outpacing U.S. population growth for over 20 years. It is one of only 10 U.S. markets expected to see most of the nation's growth over the next 40 years. Particularly around the pandemic, the metro witnessed exceptional net in-migration from more expensive markets. As a result, multifamily developers have been very active in the region for the past three years to keep up with demand, averaging 13,483 units annually. Through mid-2024, 11,597 apartment units have been delivered, nearly matching the pre-pandemic average annual total. Currently, 56,079 units are under construction throughout the metro. Projections indicate that there will be 27,667 deliveries in the Phoenix metro area by the end of the year, the highest number of annual deliveries recorded since 2002. Areas where demand is most prevalent are in cities on the outskirts of the metro, surrounding the city of Phoenix and Scottsdale like Glendale, Peoria, Deer Valley, Chandler, Gilbert, and East Mesa. Through the first half of 2024, 11,637 net move-ins have outpaced deliveries. An expected 27,805 net move-ins are projected by the end of the year. In the past five years, absorption has outpaced deliveries annually three times. Many first-time homebuyers in Phoenix are electing to continue renting due to high interest rates, limited active listings, and home prices appreciating rapidly in the Valley.
Deliveries & Absorption
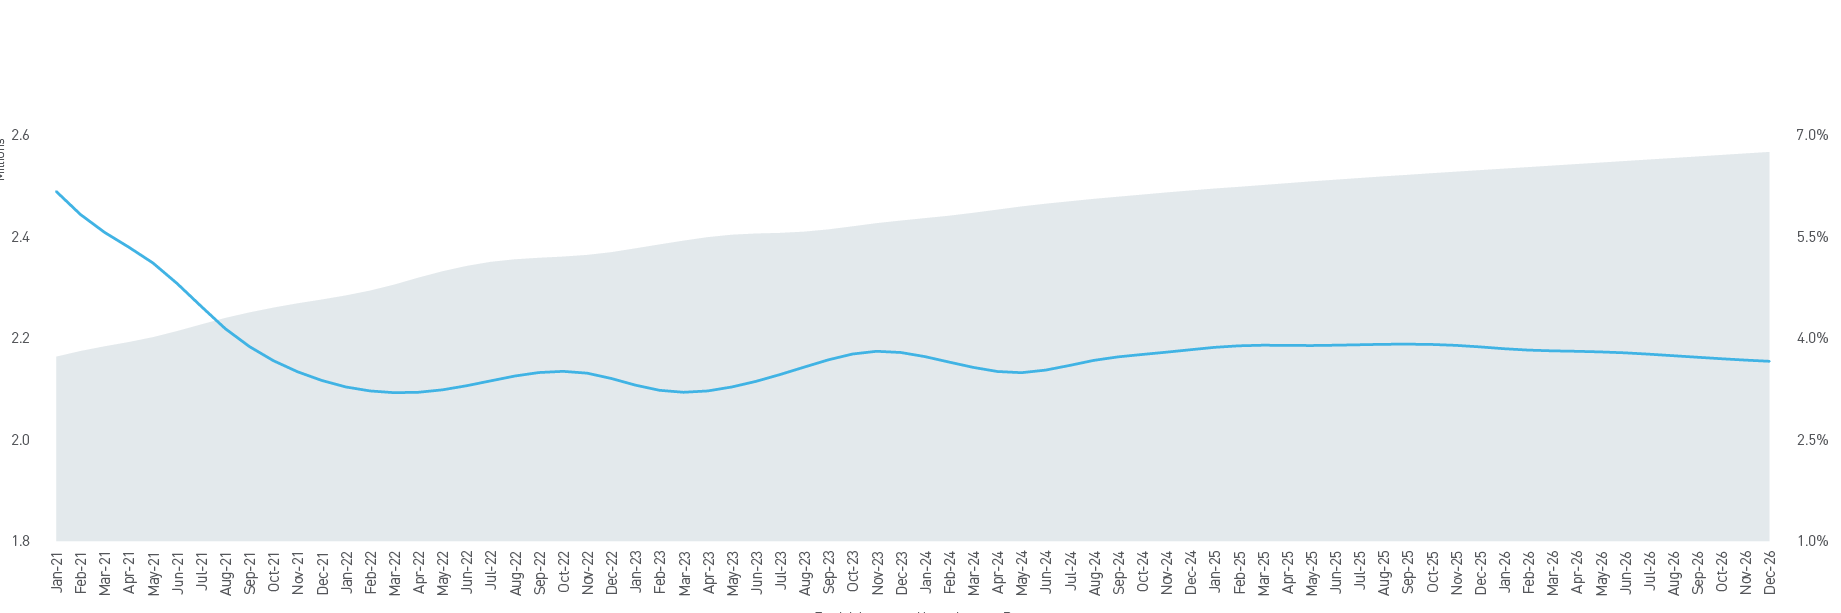
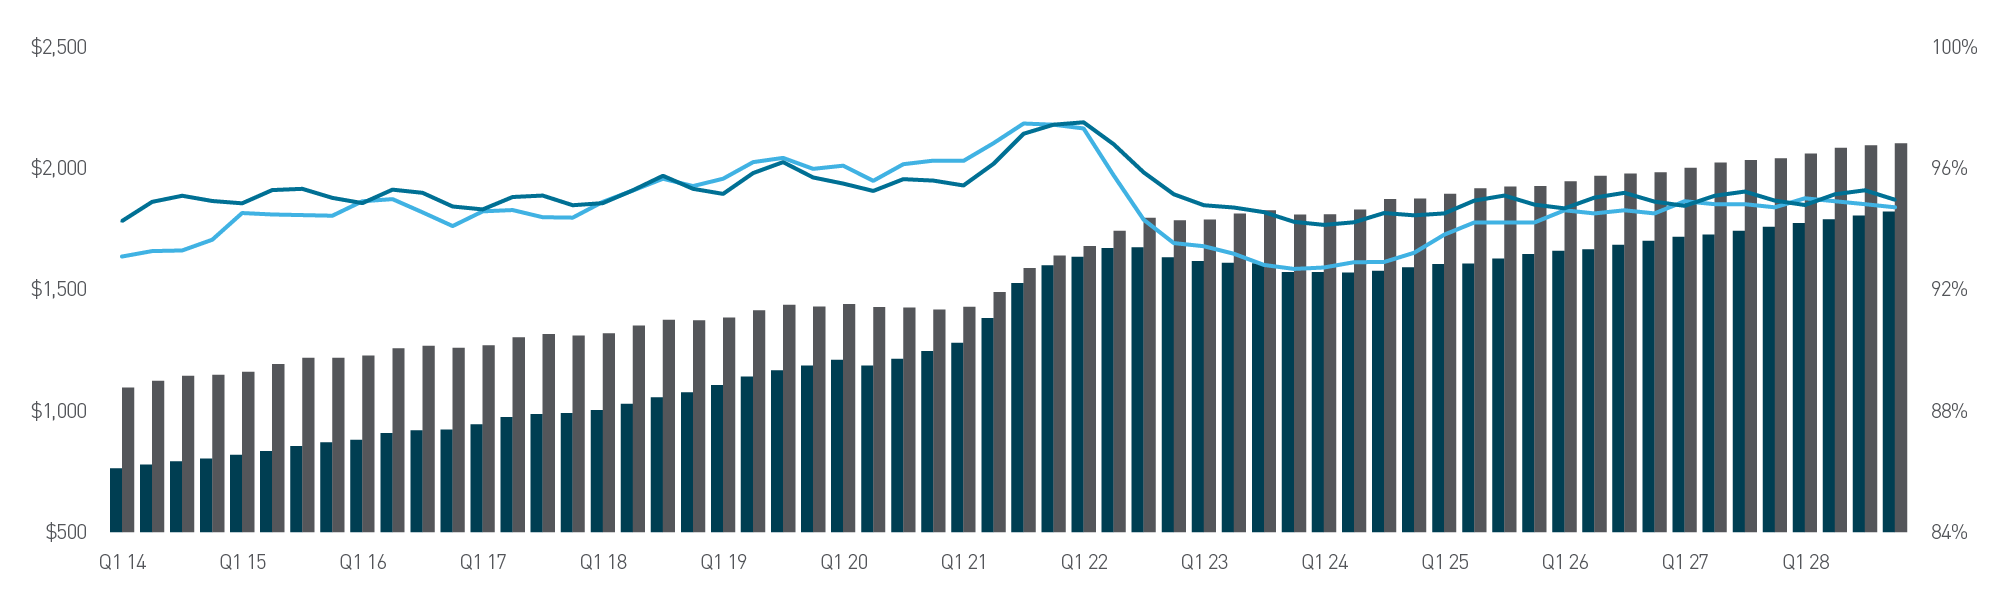
The Phoenix MSA has been a top market for multifamily investment for years. A significant factor of investment capital targeting the metro is rent growth. Five years before the pandemic, the Phoenix metro area had an average annual rent growth rate of 8.1%. Following the pandemic in 2021, rent increased 28.4%. Since then, rent growth has shifted closer to historic norms. In the second quarter of 2024, average monthly rent dropped to $1,569, a decrease of 2.5% year over year. Reasons for the drop may include a slight market reset after the rapid rent growth in the past, a record spike in the new supply coming online, and a rise of concessions eating into effective rent. Overall, the Phoenix MSA presents strong demographic trends like population growth, job growth, and quality of life that underpin health multifamily fundamentals. By the end of the fourth quarter of 2024, rents are projected to reach $1,591, an increase of 1.3% year over year. Occupancy is facing a similar trend to rents. Generally, over the past decade, the average occupancy rate has floated between 94% to 97%. With the influx of new supply, occupancy has come down. During the second quarter of 2024, average occupancy finished at 92.9%, a decrease of 30 basis points year over year. By the end of 2024, average occupancy is projected to increase to 93.2%, up 50 basis points year over year. Over the next four years, occupancy is expected to hover between 94% and 95%.
RENT & OCCUPANCY
2024 Year to Date*
VOLUME
$1,426,100,000

CAP RATE (AVG)
5.1%

Price Per Unit (AVG)
$328,589
TRANSACTIONS
16

WHAT’S TRADING?*

BUILDINGS (AVG)
32

ACRES (AVG)
10.70
YEAR BUILT (AVG)
2020s

UNITS (AVG)
264

Sources: MSCI Real Capital Analytics; CoStar Group; Berkadia Research
SALES


2024 YEAR TO DATE
DELIVERIES
11,597 UNITS

2024 TOTAL*

ABSORPTION
11,637 UNITS
DELIVERIES
27,667 UNITS
ABSORPTION
27,805 UNITS
Effective rent
Q2 2024
$1,569
2.5% YOY
OCCUPANCY
Q2 2024
92.9%
30 BPS YOY


*$50m+
SELLER
StreetLights Residential �EQT Exeter �PB Bell & Associates �OMERS �KB Investment Development Co.
Dallas, TX�Conshohocken, PA�Scottsdale, AZ�Toronto, ONT�Irvine, CA
LOCATION


Buyer
RXR Realty �Kairoi Residential �German American Realty �Olympus Property �Millburn & Company
New York, NY�San Antonio, TX�Cologne, NRW�Fort Worth, TX�Salt Lake City, UT
Location

Top Buyers*
Top Sellers*

BACK TO TOP


*Projected
Source: RealPage
Y-o-Y Effecitve Rent Change

( 7. 0 %) - ( 5. 6%)
( 5. 5%) - ( 4. 3%)
( 4. 2 %) - ( 3. 0 %)
( 2 . 9%) - ( 1 . 7%)
1 . 6%) - ( 0 . 4%)
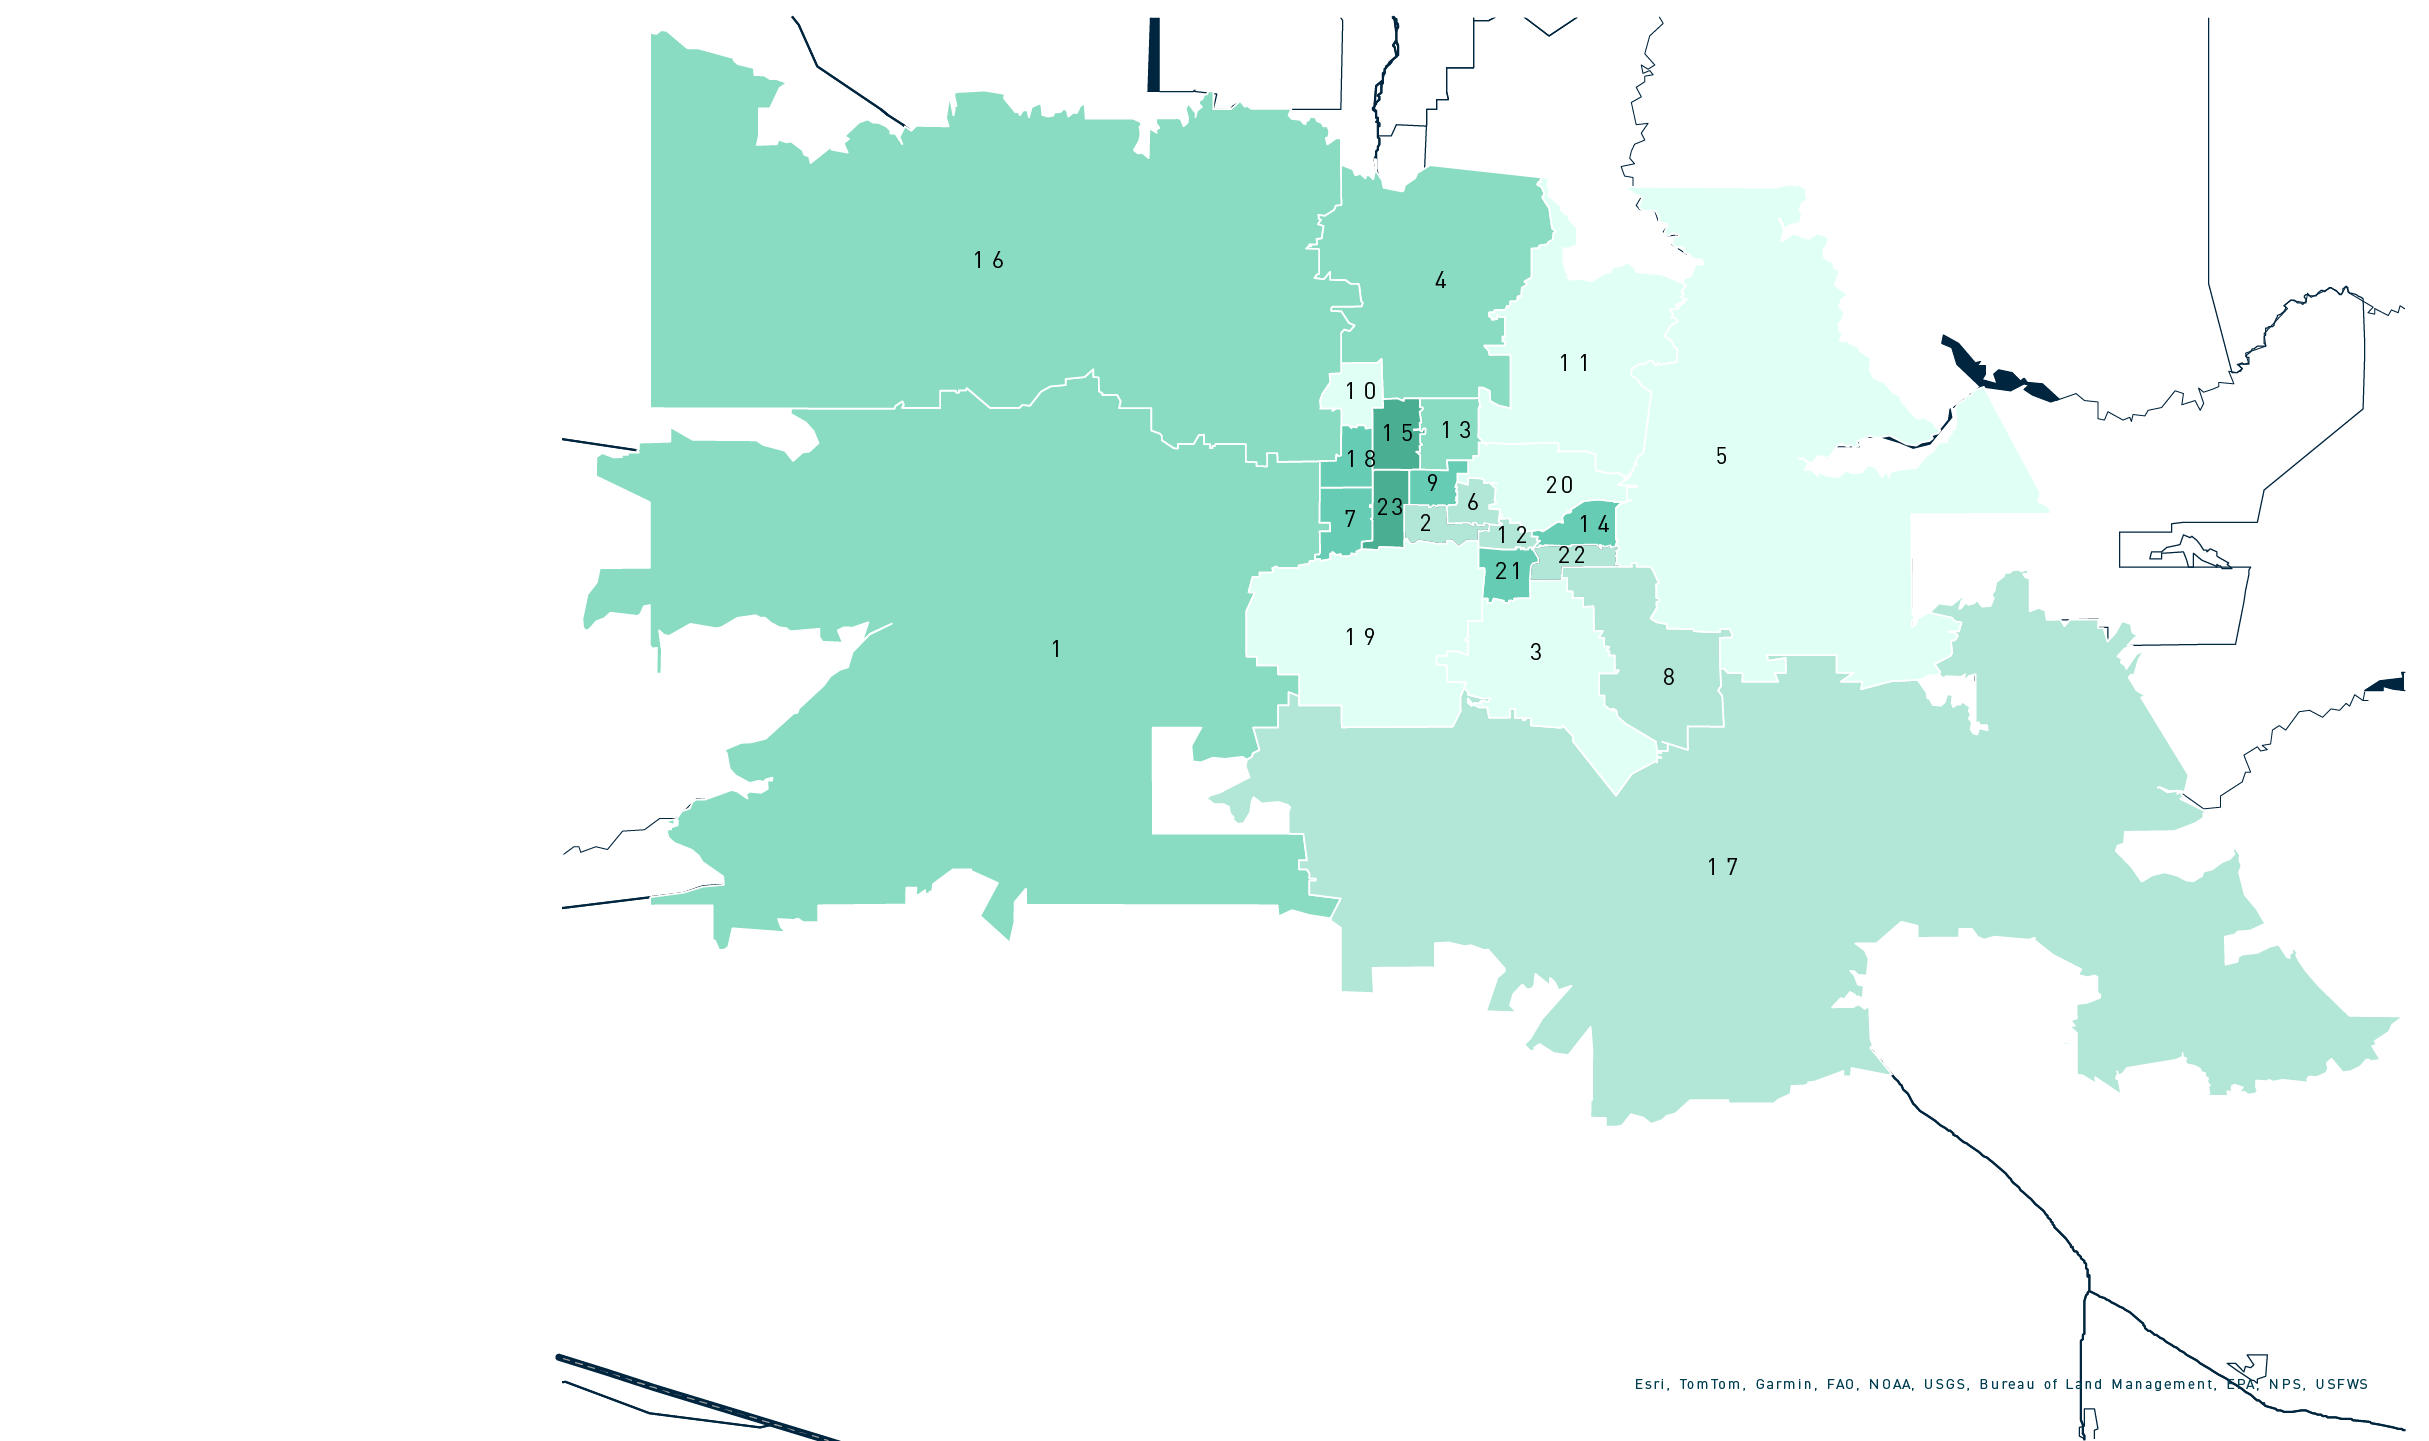
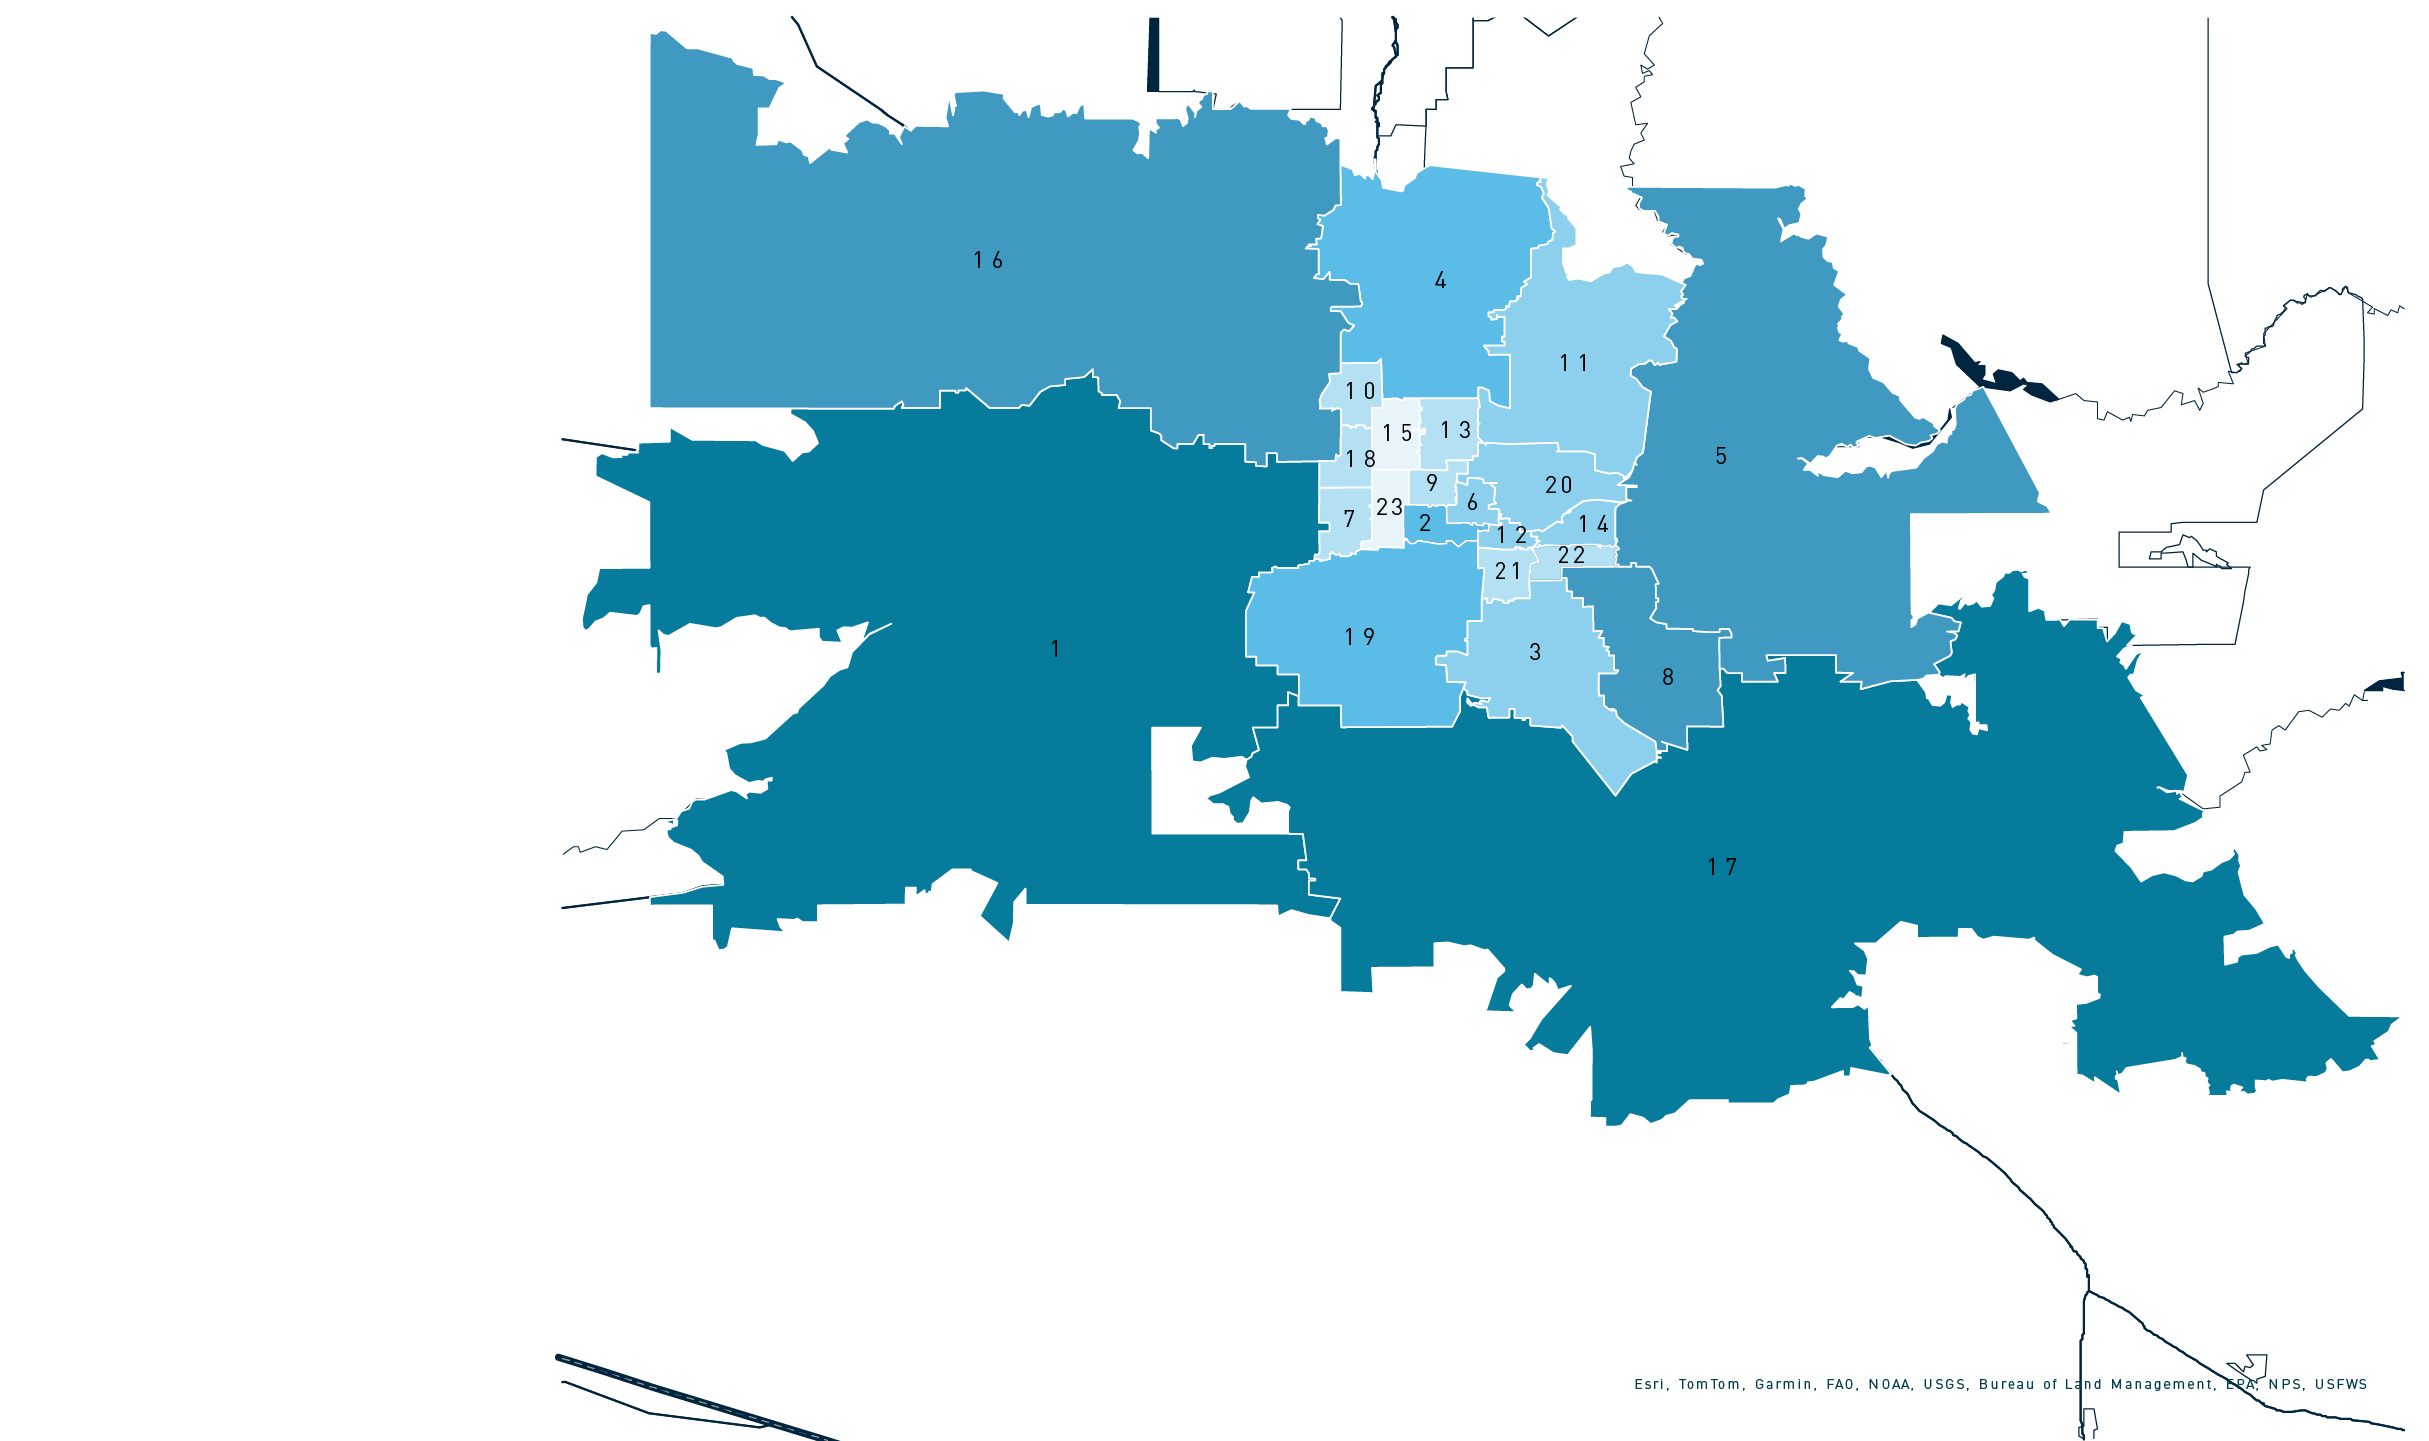
1. Avondale / Goodyear / West Glendale 2. Central Phoenix
3. Chandler
4. Deer Valley
5. East Mesa
6. East Phoenix
7. Far West Phoenix
8. Gilbert
9. North Central Phoenix
10. North Glendale
11. North Scottsdale
12. North Tempe / University
13. Northeast Phoenix
14. Northwest Mesa
15. Northwest Phoenix
16. Peoria / Sun City / Surprise
17. Pinal County
18. South Glendale
19. South Phoenix
20. South Scottsdale
21. South Tempe
22. Southwest Mesa
23. West Phoenix
SUBMARKET BOUNDARIES
It was a challenging year for apartment operators with increased competition across the Phoenix metro area. During the second quarter of 2024, average effective rent decreased in all submarkets year over year. The Chandler submarket was the most resilient, with only an annual decline of 0.4%. Landlords could get away with less of a decrease since Chandler led all submarkets in average occupancy. Chandler has become a destination for renters in the Valley, as major employers like NXP and Intel have opened or expanded state-of-the-art facilities. The submarket has great lifestyle and entertainment options, with a popular downtown area and numerous highly rated bars and restaurants. It is well positioned near multiple major highways that make many parts of the metro area highly accessible. Reflecting the resilience of the submarket, effective rent is forecast to reach $1,710 by the fourth quarter of 2024, a 0.6% annual increase. This submarket is one of many projected to record positive annual rent growth in 2024. Leading the way is the West Phoenix submarket, at 2.9% annual rent growth, followed by the South Glendale and East Phoenix submarkets, both at 2.4% annual rent growth.
SUBMARKET MID-YEAR 2024 ANNUAL RENT Change
Annual Inventory Change
0 . 0 %
0 . 1 % - 1 . 8%
1 . 9% - 4. 4%
4. 5% - 7. 6%
7. 7% - 1 2 . 1 %
1 2 . 2 % - 2 7. 2 %
1. Avondale / Goodyear / West Glendale 2. Central Phoenix
3. Chandler
4. Deer Valley
5. East Mesa
6. East Phoenix
7. Far West Phoenix
8. Gilbert
9. North Central Phoenix
10. North Glendale
11. North Scottsdale
12. North Tempe / University
13. Northeast Phoenix
14. Northwest Mesa
15. Northwest Phoenix
16. Peoria / Sun City / Surprise
17. Pinal County
18. South Glendale
19. South Phoenix
20. South Scottsdale
21. South Tempe
22. Southwest Mesa
23. West Phoenix
SUBMARKET BOUNDARIES
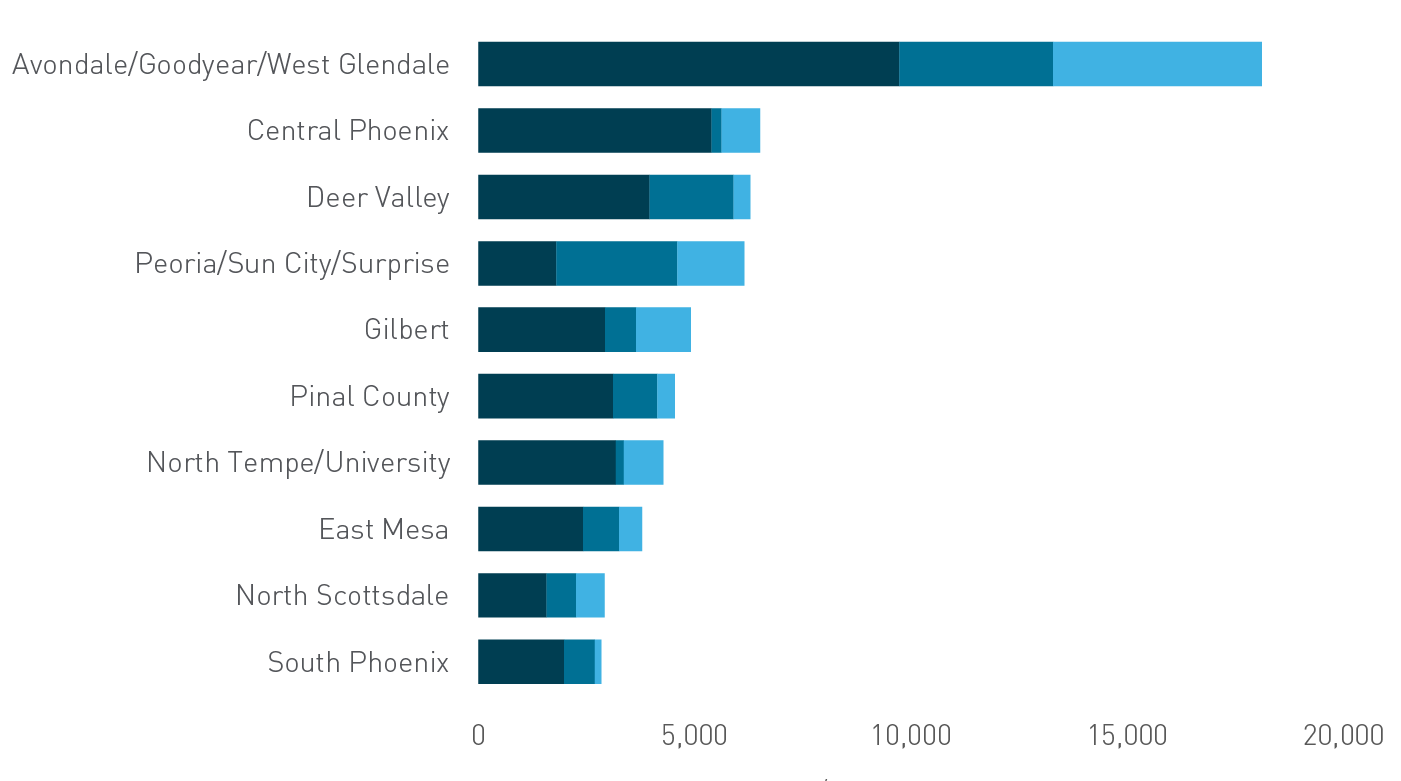
Two submarkets stood out amongst others in annual inventory growth. The Pinal County submarket led all 23 submarkets, expanding 27.2% year over year through the second quarter of 2024. An uptick in companies expanding facilities or relocating to the county, adding more jobs and demand for housing, contributed to the significant increase in the submarket. The Avondale/Goodyear/West Glendale submarket came in second in inventory growth, expanding 23.8% year over year. Like Pinal County, the Avondale/Goodyear/West Glendale submarket has experienced more companies flocking to the area, creating new jobs, mainly in manufacturing, as a rise of new industrial space continues to develop in the submarket. In addition, the submarket has benefits from a low cost of living and the development of more lifestyle and entertainment options, attracting more renters. The remaining 21 submarkets had an average annual inventory growth rate of 3.8%, with the Peoria/Sun City/Surprise, East Mesa, and Gilbert submarkets rounding out the top five.
SUBMARKET �MID-YEAR 2024 ANNUAL �Inventory Change
SUBMARKET MID-YEAR 2024 ANNUAL Inventory Change
SUBMARKET MID-YEAR 2024 ANNUAL RENT Change

QUICK ACCESS MENU
National & Institutional Markets


San Francisco-Oakland

San Jose
Atlanta
Orlando
Austin
Dallas-Fort Worth
Las Vegas
Phoenix
Salt Lake City
Washington, D.C.
Philadelphia
South Florida
Seattle-Tacoma
San Diego
Los Angeles
Orange County
Houston
Chicago
Boston
National Market Report
Atlanta
Austin
Boston
Chicago
Dallas-Fort Worth
Houston
Washington, D.C.
Phoenix
South Florida
Los Angeles
Orange County
Orlando
Philadelphia
San Diego
San Francisco-Oakland
San Jose
Seattle-Tacoma
Las Vegas
Salt Lake City

QUICK ACCESS MARKET MENU
© 2024 Berkadia Real Estate Advisors LLC
Berkadia® is a trademark of Berkadia Proprietary Holding LLC Commercial mortgage loan origination and servicing businesses are conducted exclusively by Berkadia Commercial Mortgage LLC and Berkadia Commercial Mortgage Inc. This website is not intended to solicit commercial mortgage loan brokerage business in Nevada. Investment sales and realestate brokerage businesses are conducted exclusively by Berkadia Real Estate Advisors LLC and Berkadia Real Estate Advisors Inc. For state licensing details for the above entities, visit: www.berkadia.com/legal/licensing.aspx
The information contained in this flyer has been obtained from sources we believe to be reliable; however, we have not conducted any investigation regarding these matters and make no warranty or representation whatsoever regarding the accuracy or completeness of the information provided. While we do not doubt its accuracy, we have not verified it and neither we, nor the Owner, make any guarantee, warranty or representation of any kind or nature about it. It is your responsibility to independently confirm its accuracy and completeness. Any projections, opinions, assumptions or estimates used are for example and do not necessarily represent past, current or future performance of the property. You and your advisors should conduct a careful and independent investigation of the property to determine to your satisfaction the suitability of the property and the quality of itstenancy for your records.

EMPLOYMENT
DELIVERIES & ABSORPTION
ANNUAL INVENTORY CHANGE
RENT & OCCUPANCY
ANNUAL RENT CHANGE
QUICK ACCESS MARKET MENU
QUICK ACCESS MENU
National & Institutional Markets
San Francisco-Oakland
San Jose
Austin
Dallas-Fort Worth
Las Vegas
Phoenix
Salt Lake City
Washington, D.C.
Philadelphia
Seattle-Tacoma
San Diego
Los Angeles
Orange County
Houston
Chicago
Boston
National Market Report
Atlanta

Austin

Boston

Chicago

Dallas-Fort Worth

Houston

Washington, D.C.

Phoenix

South Florida

Los Angeles

Orange County

Orlando

Philadelphia

San Diego

San Francisco-Oakland

San Jose

Seattle-Tacoma

Las Vegas

Salt Lake City

Atlanta
Orlando
South Florida

Under Construction/Lease-Up
Lease-Up
Under Construction / Lease-Up
Lease-Up
Deliveries
Absorption
Effective Rent Change
Source: RealPage
Source: RealPage
National Effective Rent
Phoenix vs. National Effective Rent & Occupancy
Phoenix Occupancy
SUBMARKET PERFORMANCE


Source: Moody’s Analytics
Source: RealPage
South Tempe�Southwest Mesa�West Phoenix
93.1%�92.6%�91.2%
-50�-10�-40
$1,561�$1,382�$1,106
-4.7%�-2.7%�-6.0%
North Scottsdale�North Tempe/University�Northeast Phoenix�Northwest Mesa�Northwest Phoenix�Peoria/Sun City/Surprise�Pinal County�South Glendale�South Phoenix�South Scottsdale
93.0%�92.5%�93.4%�93.3%�92.2%�93.2%�89.2%�91.2%�92.9%�93.8%
-40�-20�-30�-40�-110�-80�-200�-150�-130�40
$1,992�$1,667�$1,461�$1,351�$1,213�$1,593�$1,334�$1,235�$1,631�$1,918
-1.7%�-2.9%�-3.6%�-4.9%�-7.0%�-3.3%�-2.7%�-3.6%�-1.0%�-1.6%
Avondale/Goodyear/West Glendale�Central Phoenix�Chandler�Deer Valley�East Mesa�East Phoenix�Far West Phoenix�Gilbert�North Central Phoenix�North Glendale
92.3%�92.0%�94.2%�93.6%�93.4%�92.8%�92.4%�93.3%�92.4%�93.5%
-40�-110�40�60�-10�-10�-70�40�-10�20
$1,575�$1,750�$1,728�$1,701�$1,654�$1,448�$1,329�$1,711�$1,530�$1,580
-3.8%�-1.9%�-0.4%�-3.1%�-1.4%�-2.8%�-3.4%�-1.8%�-5.4%�-1.3%
Q2 2024 Occupancy
YOY (BPS)
Q2 2024 Effective Rent
YOY
1/3
2/3
3/3


ANNUAL INVENTORY CHANGE
DELIVERIES & ABSORPTION
EMPLOYMENT
ANNUAL RENT CHANGE

SALES
RENT & OCCUPANCY
SUBMARKET MID-YEAR 2024 ANNUAL RENT Change
SUBMARKET MID-YEAR 2024 ANNUAL Inventory Change
Deliveries, Absorption, & effective rent change
Market Pipeline
Top submarket pipelines
Under Construction
Under Construction
DOWNLOAD FULL REPORT
DOWNLOAD FULL REPORT


Unemployment Rate
Total Jobs
Phoenix Effective Rent
National Occupancy
Effective rent and occupancy reflect stabilized properties and does not include preleased units or properties in lease-up. A newly constructed property is considered stabilized once it becomes 85% occupied.
*Seasonally Adjusted
